
Page 18 - Hoftex Annual Report 2018 EN
P. 18
Letter to Shareholders Supervisory Board Report
Group Management Report Consolidated Financial Statements Annexes
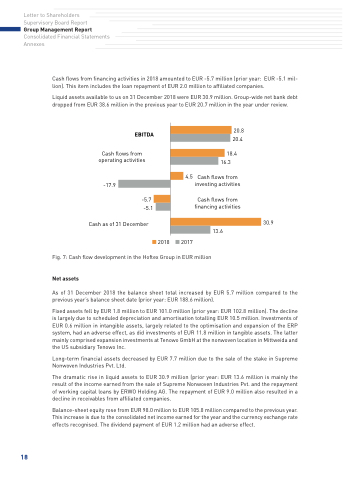
Cash flows from financing activities in 2018 amounted to EUR -5.7 million (prior year: EUR -5.1 mil- lion). This item includes the loan repayment of EUR 2.0 million to affiliated companies.
Liquid assets available to us on 31 December 2018 were EUR 30.9 million. Group-wide net bank debt dropped from EUR 38.6 million in the previous year to EUR 20.7 million in the year under review.
EBITDA
20.8 20.4
Cash flows from 18.4
operating activities
16.3 4.5 Cash flows from
-17.9
Cash as of 31 December
financing activities
investing activities -5.7 Cash flows from
-5.1
2018 2017
13.6
30.9
Fig. 7: Cash flow development in the Hoftex Group in EUR million
As of 31 December 2018 the balance sheet total increased by EUR 5.7 million compared to the previous year’s balance sheet date (prior year: EUR 188.6 million).
Fixed assets fell by EUR 1.8 million to EUR 101.0 million (prior year: EUR 102.8 million). The decline is largely due to scheduled depreciation and amortisation totalling EUR 10.5 million. Investments of EUR 0.6 million in intangible assets, largely related to the optimisation and expansion of the ERP system, had an adverse effect, as did investments of EUR 11.8 million in tangible assets. The latter mainly comprised expansion investments at Tenowo GmbH at the nonwoven location in Mittweida and the US subsidiary Tenowo Inc.
Long-term financial assets decreased by EUR 7.7 million due to the sale of the stake in Supreme Nonwoven Industries Pvt. Ltd.
The dramatic rise in liquid assets to EUR 30.9 million (prior year: EUR 13.6 million is mainly the result of the income earned from the sale of Supreme Nonwoven Industries Pvt. and the repayment of working capital loans by ERWO Holding AG. The repayment of EUR 9.0 million also resulted in a decline in receivables from affiliated companies.
Balance-sheet equity rose from EUR 98.0 million to EUR 105.8 million compared to the previous year. This increase is due to the consolidated net income earned for the year and the currency exchange rate effects recognised. The dividend payment of EUR 1.2 million had an adverse effect.
18
Net assets
