
Page 2 - Hoftex Annual Report 2018 EN
P. 2
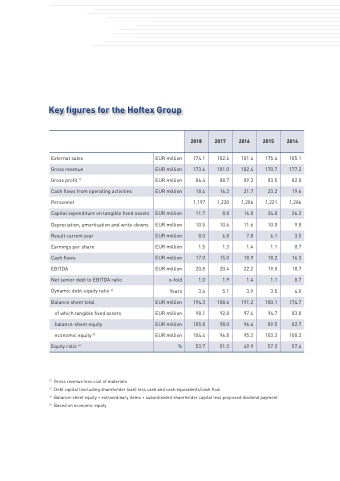
  Key figures for the Hoftex Group
  External sales
Gross revenue
Gross profit 1)
Cash flows from operating activities
Personnel
Capital expenditure on tangible fixed assets
Depreciation, amortisation and write-downs
Result current year
Earnings per share
Cash flows
EBITDA
Net senior debt to EBITDA ratio
Dynamic debt-equity ratio 2)
Balance sheet total
of which tangible fixed assets
balance-sheet equity
economic equity 3)
Equity ratio 4)
EUR million
EUR million
EUR million
EUR million
EUR million
EUR million
EUR million
EUR million
EUR million
EUR million
EUR million
EUR million
EUR million
EUR million
x-fold
Years
%
2018
174.1
173.6
86.4
18.4
1,197
11.7
10.5
8.0
1.5
17.0
20.8
1.0
3.4
194.3
98.1
105.8
104.4
53.7
2017
182.6
181.0
88.7
16.3
1,220
8.8
10.6
6.8
1.3
15.0
20.4
1.9
5.1
188.6
92.8
98.0
96.8
51.3
2016
181.4
182.4
89.3
21.7
1,206
16.0
11.6
7.8
1.4
18.9
22.2
1.4
3.9
191.2
97.4
96.4
95.3
49.9
2015
175.4
170.7
83.5
23.2
1,221
24.8
10.0
6.1
1.1
18.2
19.0
1.1
3.5
180.1
94.7
89.5
103.3
57.3
2014
185.1
177.2
82.0
19.6
1,286
26.2
9.8
3.5
16.3
0.7
174.7
82.7
57.4
                 0.7
18.7
4.0
83.8
100.3
      1) Gross revenue less cost of materials
2) Debt capital (excluding shareholder loan) less cash and cash equivalents/cash flow
3) Balance-sheet equity + extraordinary items + subordinated shareholder capital less proposed dividend payment
4) Based on economic equity
